What Is Packaging OPEX and How to Reduce It
Packaging OPEX covers the daily running expenses of a line, including energy, consumables, labor, and maintenance. Reducing it requires tracking each cost driver, fixing inefficiencies, and validating machine performance against production output.
- Packaging OPEX includes energy, consumables, labor, and maintenance.
- Track cost per unit, not just total spending.
- Preventive maintenance lowers long-term maintenance cost.
- Consumable quality affects yield and operating cost.
- Use real production data to validate savings.
What packaging OPEX actually includes
Packaging OPEX is the cost of running a line after the machine is purchased. It covers everything that happens between the moment a product enters the line and the moment it leaves. This includes electricity for motors and drives, compressed air for pneumatic actuators, heat for sealing or forming, and the consumables that touch the product.
The line does not run on power alone. It runs on a mix of mechanical motion, pneumatic force, and thermal energy. A rotary filler uses drive motors for the star wheel and the product infeed. It uses heaters for the bottle neck if it is glass. It uses compressed air for the capping torque check and the final inspection. Every one of these loads adds to the monthly bill.
Labor sits in the same bucket. You pay operators, maintenance technicians, and shift supervisors to keep the line moving. A modern line rarely runs without human input. Operators load material, clear jams, and verify the first few units. Technicians handle belt tracking, seal bar adjustment, and sensor alignment. Supervisors manage the shift schedule and quality checks.
Depreciation is usually treated as a capital cost, but some teams include it in operating figures. For sourcing decisions, it is safer to separate capital from operating expenses. If you mix the two, you lose visibility into whether a machine is efficient or whether it is simply expensive to own over time.
Consumables define a large share of the bill. Films, labels, caps, glue, and trays all add up. A small change in film thickness or label adhesive can shift the cost per unit. A thinner film may be cheaper per roll, but it can stretch or tear during the forming stage. A stronger adhesive may cost more per label, but it reduces the rate of label slippage during transport.
Maintenance cost is not just repairs. It includes lubricants, filters, spare parts, and the labor hours spent keeping equipment available. It also includes the cost of lost production when a machine stops for a minor fault. A ten-minute stop on a high-speed line can waste more product than the cost of the part that caused the stop.
How operating cost changes sourcing decisions
When you compare two machines, the sticker price rarely tells the whole story. One machine may use less energy per cycle but need more frequent part replacement. Another may run faster but consume more material due to waste.
Throughput is the first metric buyers check. It is the number of units per hour. But throughput alone does not explain the cost of running those units. A machine that runs at 5,000 units per hour with a 2% reject rate costs more than a machine that runs at 4,500 units per hour with a 0.5% reject rate, if the energy and material costs are similar.
Buyers should also look at how the machine handles changeovers. If a line switches formats often, the operating cost of changeovers matters. Changing from a 330ml bottle to a 500ml bottle involves adjusting the infeed guides, the filler heads, and the labeling station. Each adjustment takes time. That time is labor, and it is energy. It is also a risk window where quality defects can happen.
A useful check is to ask the vendor for a sample unit economics sheet. It should show energy use per hour, material per unit, and expected maintenance intervals. You can compare these figures against your own line data. This avoids guessing and gives you a baseline for negotiation.
Do not rely on the vendor’s nameplate energy rating alone. The nameplate is the maximum draw under ideal conditions. The real energy use depends on the product, the speed, and the ambient temperature. A heater that runs at 150 degrees Celsius in a cold warehouse draws more power than the same heater in a warm room.
Where maintenance cost hides its biggest impact
Maintenance cost looks like a line item on the invoice, but it is driven by behavior. Reactive fixes are expensive. They interrupt production and often cause secondary damage. A worn bearing replaced late can damage the gearbox. A loose belt left to slip can burn the motor.
Preventive maintenance keeps parts within tolerance. It includes scheduled lubrication, filter changes, belt tension checks, and sensor calibration. The labor cost is predictable. The machine stays available.
Teams that track maintenance by failure mode see patterns fast. If one area fails repeatedly, the root cause may be a misaligned drive or a contaminated air supply. Fixing the root cause lowers maintenance cost over time.
For example, a labeling machine may show a high rate of label misses. The team might replace the label head. If the label head was fine, the real cause could be a dirty label web path or a misaligned guide. Replacing the head solves nothing. Cleaning the path and realigning the guide solves the problem for a fraction of the cost.
Maintenance records are a diagnostic tool. Keep a log of parts replaced, labor hours spent, and the reason for the stop. After three months, you can see which components fail most often. This data helps you plan spare parts inventory and identify design weaknesses.
How energy and utility bills feed OPEX
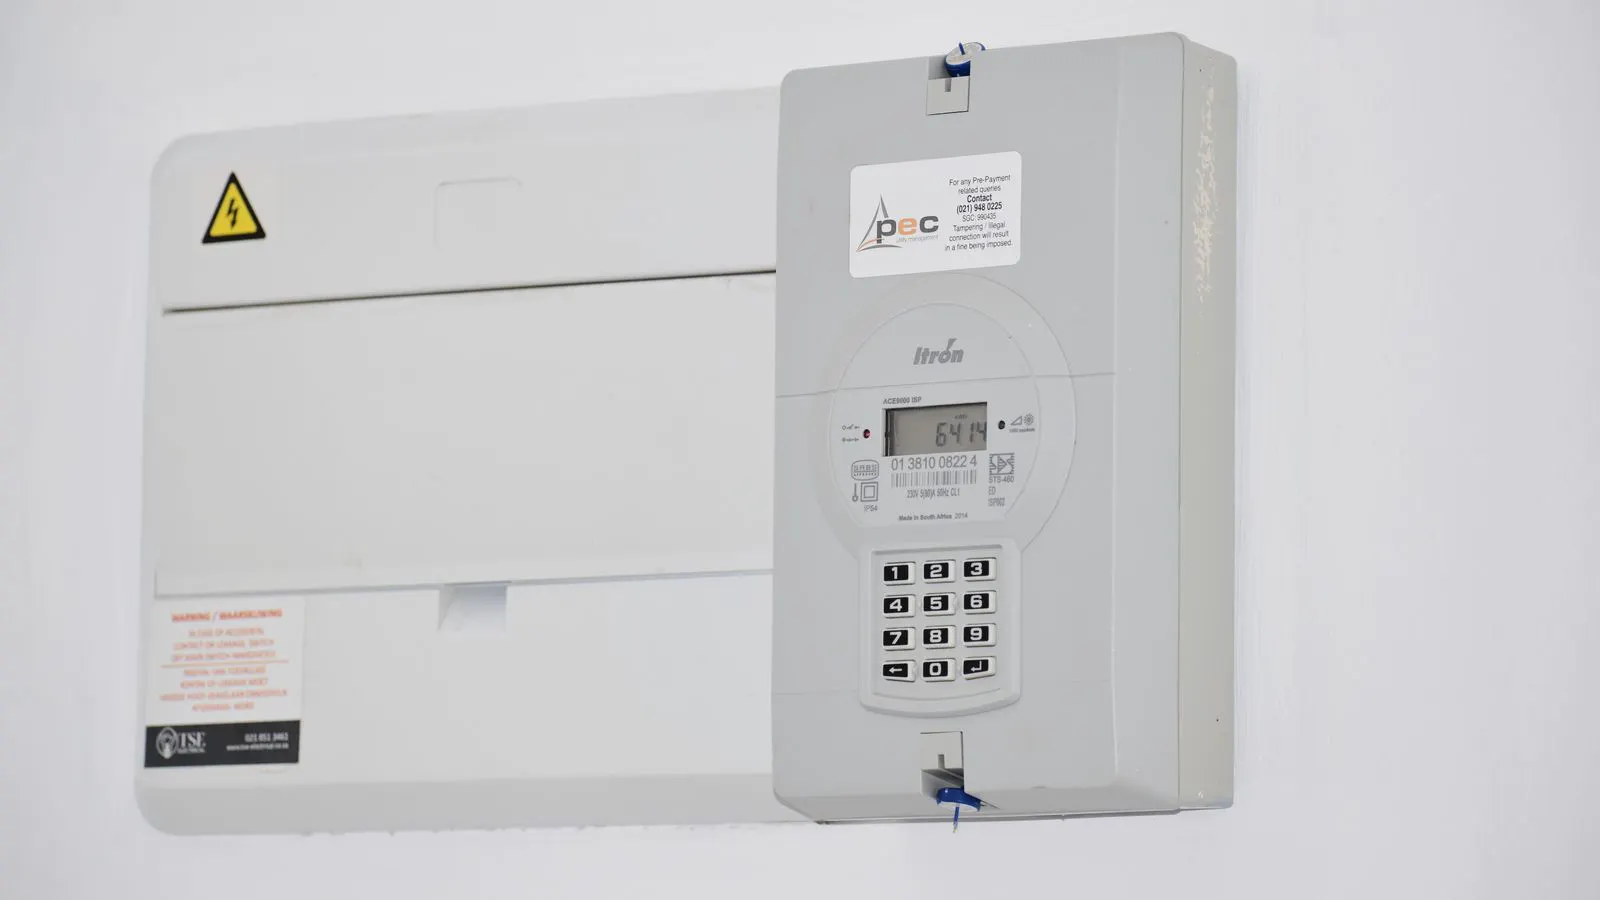
Energy is a major operating cost. Motors, heaters, and pneumatic systems draw power continuously. Even idle machines use energy. Compressors and chillers can add a hidden load.
The energy profile is not flat. It changes with the production cycle. A sealing machine draws high power when the seal bar heats up. A capping machine draws high power when the cap torque is applied. A filling machine draws high power during the product transfer.
Check the power profile during a full production cycle. Note the peak and average draw. Compare it to the nameplate rating. A machine that draws significantly more than expected may have a failing component. A motor with a worn bearing draws more current. A heater with a failed thermostat draws more power than necessary.
Compressed air leaks are a common issue. A small leak at a fitting can waste a large amount of energy. A simple pressure test can find them. Fixing leaks reduces utility cost and can extend component life.
Pneumatic systems are less efficient than electric systems. They convert electrical energy into compressed air, which then loses energy as heat during expansion. A single actuator that cycles many times per hour uses more energy than an equivalent electric actuator.
Consumables and yield: the quiet cost drivers
A film that stretches too much causes rejects. A label adhesive that fails in storage creates returns. These issues appear as quality cost, but they also drive up operating cost because the line runs longer to make up for losses.
Yield is the percentage of good units produced. A line with 98% yield produces 2% waste. A line with 95% yield produces 5% waste. The difference is not small. It is a direct cost in material, energy, and labor.
Test consumables under real conditions. Run the actual product at the target speed. Check for seal integrity, label placement, and tray nesting. A small adjustment in temperature or pressure can improve yield.
Keep records of consumable lot numbers and reject rates. If a new roll causes more rejects, you can trace the issue. This prevents small problems from becoming large cost events.
Material quality is not static. A film supplier may change the resin blend without telling you. A label printer may change the ink. These changes can affect the performance of your packaging line. Always test new material lots before full production.
A worked example in plain words
A bottler runs a capping and labeling line. The machine is new and fast. The team tracks one week of data.
Energy use is higher than expected during the first hour of each shift. The startup sequence runs the heaters to full power even when the line is not at speed. Adjusting the startup sequence lowers energy use.
Labels misalign when the product temperature changes. The adhesive needs a warm-up period. Adding a short preheat step reduces rejects.
A worn guide rail causes bottles to bump. The team replaces the rail and adds a sensor to detect misalignment. Maintenance cost drops because the guide no longer fails.
The line still produces the same output. The cost per unit is lower. The savings come from small fixes, not a new machine.
This example shows how OPEX is not a single number. It is a collection of small costs that add up. Each fix, no matter how small, reduces the total.
How to build a simple OPEX tracking system
Start with a spreadsheet or a basic database. Record daily production, energy use, consumable usage, labor hours, and maintenance events. Use the same units every day.
Break the cost down by shift and by product. This shows where the money goes. A shift with low output but high energy use needs attention. A product with high reject rates needs a quality check.
Review the numbers weekly. Look for trends, not just single days. A rising maintenance cost over three weeks points to a developing issue. A spike in consumable use after a changeover suggests a setup problem.
Keep the system simple. If it takes too much time to update, people will stop using it. A good OPEX tracking system should take less than ten minutes to update per shift.
A practical OPEX cost breakdown table
| Cost Driver | Typical Source | How to Check |
|---|---|---|
| Energy | Motors, heaters, compressors | Meter per shift, check power curve |
| Consumables | Film, labels, caps, glue | Count usage per unit produced |
| Labor | Operators, technicians | Log hours per shift and task |
| Maintenance | Parts, lubricants, repairs | Log parts used and labor hours |
| Quality Loss | Rejects, rework, returns | Track reject rate per batch |
| Changeover | Setup time, material waste | Time each format change |
How to reduce packaging OPEX without cutting corners
You cannot cut energy use to zero. You can reduce waste. Start with the largest cost driver. If energy is highest, fix leaks and idle draw. If consumables are highest, test material quality and adjust settings.
Train operators on setup and cleaning. A clean line runs better. A well-trained operator spots issues early. This reduces maintenance cost and improves yield.
Review the line layout. If operators walk far to reach controls or parts, time is lost. Small layout changes can save minutes per shift.
Validate savings with data. After a change, track the same metrics for at least one full production cycle. Do not assume a fix worked because the machine looks better. Measure it.
What to avoid when managing OPEX
Do not chase the lowest consumable price without testing performance. A cheap film that tears costs more than a slightly pricier one that seals well.
Do not ignore minor maintenance. A small vibration or a loose belt can become a major failure. Catching it early is cheaper than downtime.
Do not compare machines only on price. A machine that needs more service or uses more energy will erode the initial savings. Use real operating data to make the final call.
Final check before you commit
Before you sign off on a new line or a major upgrade, ask for a sample run. Test it with your actual product and speed. Measure energy, material, and labor. Compare the numbers to your baseline.
If the machine runs well on your data, the OPEX will be lower. If it does not, the problem is not the price tag. It is a fit issue. Fix the fit first. Then the cost numbers will follow.
Frequently asked questions
What is the biggest part of packaging OPEX?
Energy and consumables are usually the largest daily costs. Labor and maintenance follow, depending on the line complexity.
Can I reduce OPEX without buying a new machine?
Yes. Fixing energy waste, improving consumable quality, and tightening maintenance routines lower cost per unit.
How do I measure maintenance cost accurately?
Track parts used, labor hours, and downtime caused by repairs. Group them by failure mode to see patterns.
Is energy use the same as operating cost?
No. Energy is one part of operating cost. Consumables, labor, maintenance, and quality loss are also included.
What data do I need to compare two machines?
Use energy per unit, material per unit, labor hours per shift, and maintenance intervals. Test both with your actual product.